Monitor your application with MicroProfile Metrics
By Jim Ma | May 30, 2020

When Restful service is created and running in production environment, it's always required to expose some metrics data for devops team to collect to know if this application is running in good and healthy mode. MicroProfile Metrics provides standard way to expose metrics with java Annotation and developer API to build their own metrics. Expose metrics data is very easy with MicroProfile Metrics. Adding an annotation to a resource method will be the all thing thing to do like:
  @Counted(description = "counter of the Hello call", absolute = true)
  public Response hello() {
      return Response.ok("Hello From WildFly!").build();
  }
MicroProfile Metrics provides these annotations to expose different types of metrics:
- @Metered: the frequency of invocations of the annotated object with default unit: "per second"
- @Timed: tracks duration of the annotated object with default unit "nanoseconds"
- @SimplyTimed: SimplyTimed.class
- @Counted: metric type of an incrementing value
- @Gauge: tracks the annotated object, it just returns a value
- @ConcurrentGauge: Gauge the number of parallel invocations of the marked methods or constructors.
The target class, method, field with above annotation(s) will be scanned and register these metrics to MetricsRegistry automatically. And these metrics data will be exposed from MetricRegistry with REST API like : http://localhost:8080/metrics/application. MicroProfile Metrics provides another approach to manually register metrics to MetricsRegistry. Here we only focus on the annotation way to automatically register metrics.
After registering, Metrics data value will be available with JSON or OpenMetrics format. The OpenMetrics format can be directly consumed by Prometheus to store data, create alerts or better visualize. In this blog, we go through some practical steps to expose the metrics data for your existing application with MicroProfile Metrics and collect data with Prometheus and visualize data with Grafana.
Add MicroProfile Metrics dependency and annotate your resource method
To annotate your resource method, MicroProfile Metrics dependency is required to add to your maven or gradle project.
<dependency>
  <groupId>org.eclipse.microprofile.metrics</groupId>
  <artifactId>microprofile-metrics-api</artifactId>
  <scope>test</scope>
  <version>2.3</version>
</dependency>
To make your jaxrs application observable,we annotate the getMPMetricsInfo method to expose two kind metrics data:
- @Timed is to track the time spent in method getMPMetricsInfo
- @Counted to know how many times this method is called.
@Path("/")
public class MetricsEndpoint
{
 @GET
 @Path("/mpinfo")
 @Produces(MediaType.APPLICATION_JSON)
 @Timed(name = "getMPMetricsInfoTimed", description = "Metrics to monitor the times spent in getMPMetricsInfo method", unit = MetricUnits.SECONDS, absolute = true)
 @Counted(description = "counter of the getMPMetricsInfo method", absolute = true)
 public String getMPMetricsInfo() {
     return "MicrpProfle Metrics API 2.3";
 }
}
Deploy to Container with MicroProfile Metrics implementation
If a container has MicroProfile Metrics implementation, it will automatically detect and handle metrics register job as MicroProfile spec says. The only thing you need to check if this works by access "/metrics/base" or "metrics/application". WFLY15 and above has already shipped MicroProfile Metrics implementation smalley-metrics. But we suggest to try this with latest WildFly release 19.1.0.Final, because it includes many upgrades and bug fix about MicroProfile implementation.
To expose metrics, there isn't extra thing to configure or change. Redeploy the application with these new annotation will be enough.Once the deployment is deployed successfully, run curl command to test if this application's metrics is exposed.
curl -X OPTIONS -H "Accept: application/json" http://localhost:9990/metrics/application
{
  "getMPMetricsInfo": {
      "unit": "none",
      "type": "counter",
      "description": "counter of the getMPMetricsInfo method",
      "displayName": "",
      "tags": [
          [
          ]
      ]
  },
  "getMPMetricsInfoTimed": {
      "unit": "seconds",
      "type": "timer",
      "description": "Metrics to monitor the times spent in getMPMetricsInfo method",
      "displayName": "",
      "tags": [
          [
          ]
      ]
  }
}
To view the OpenMetrics format data, directly run with curl http://localhost:9990/metrics/application .
Integrate with Prometheus and Grafana
After the metrics datas are exposed successfully, we can import metrics to prometheus to store and analyze with prometheus configuration file in a docker container:
docker run -p 9090:9090 -v /path/to/prometheus.yml:/etc/prometheus/prometheus.yml:Z --network host prom/prometheus
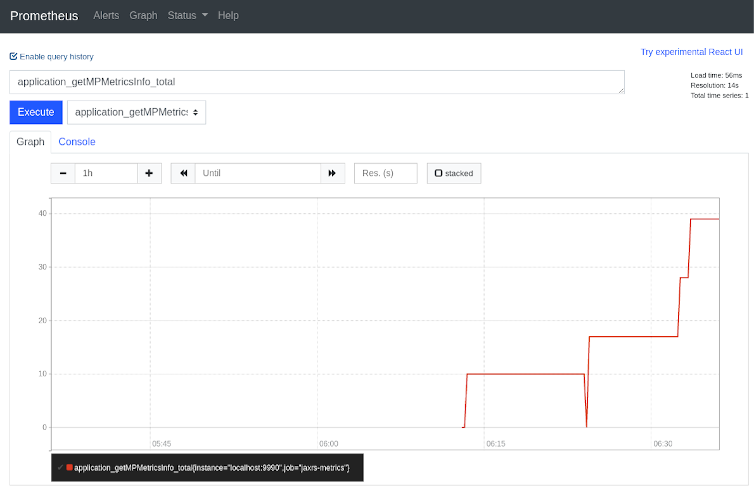
Please note the :Z is required for mount volume for docker in a Selinux enabled environment. Flag --network host to connect container to host network, it allows the container can pull metrics data from url http://localhost:9990/metrics/. After Prometheus docker container is started, the metrics data will be collected and displayed in Prometheus console at http://localhost:9090

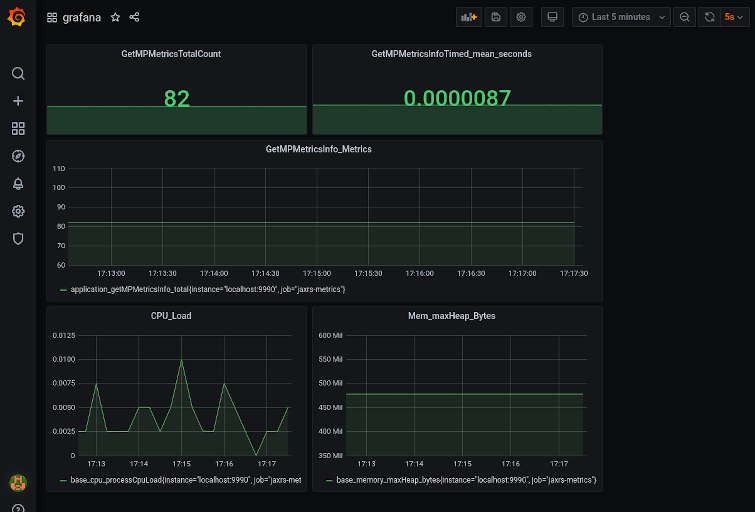
To better visualize the metrics data, Grafana dashboard is commonly used to pari with Prometheus. Like start prometheus , start Grafana with docker run is very convenient:
docker run --rm -p 3000:3000 --network host grafana/grafana
Grafana requires the user to create a datasource, dashboard before visualizing data. For more details, please check Grafana quickstart Dashboard configuration can be saved to json format file. Import this grafana dashboard configuration example to look at what metrics datas coming from prometheus is displayed in Grafana:

Summary
MicroProfile Metrics provides convenient annotation to easily expose metrics data. JaxRS application can easily provide metrics data to Prometheus and Grafana to better analyzing, visualizing. All classes and configuration file in this blog can be found in this git repository. Hope this will help to add more observability to your Resteasy/JaxRS application.
Reference
- https://microprofile.io/project/eclipse/microprofile-metrics/spec/src/main/asciidoc/app-programming-model.adoc
- https://microprofile.io/project/eclipse/microprofile-metrics/spec/src/main/asciidoc/architecture.adoc
- http://www.projectatomic.io/blog/2015/06/using-volumes-with-docker-can-cause-problems-with-selinux/


